

Park City MLS Monthly Activity Report - July 2023
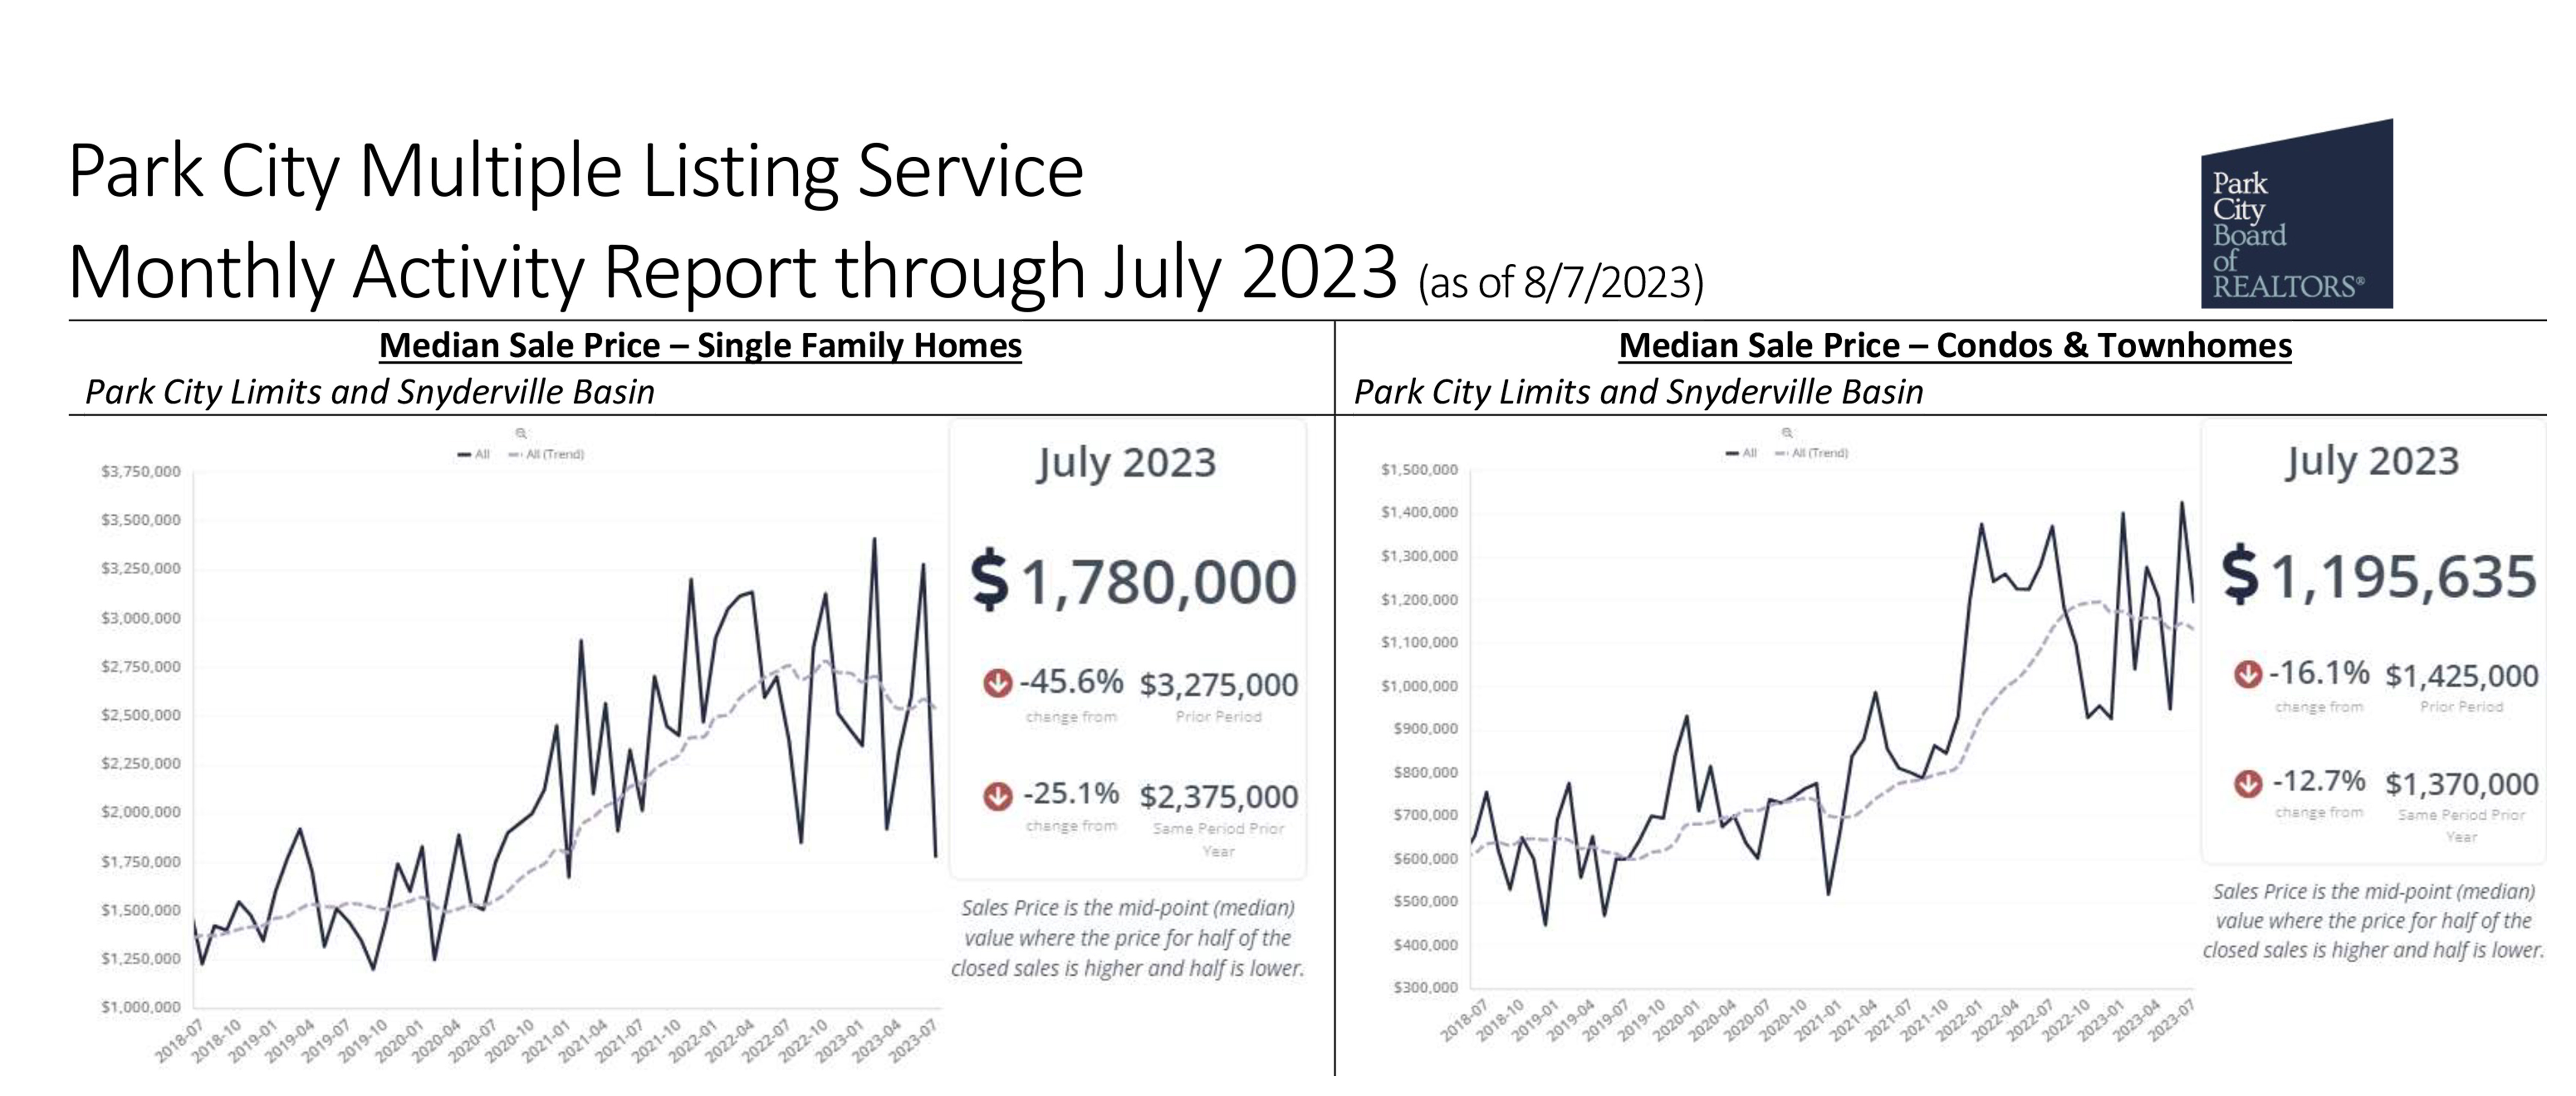
Above numbers compared to the same period prior year.
Park City MLS Activity Report
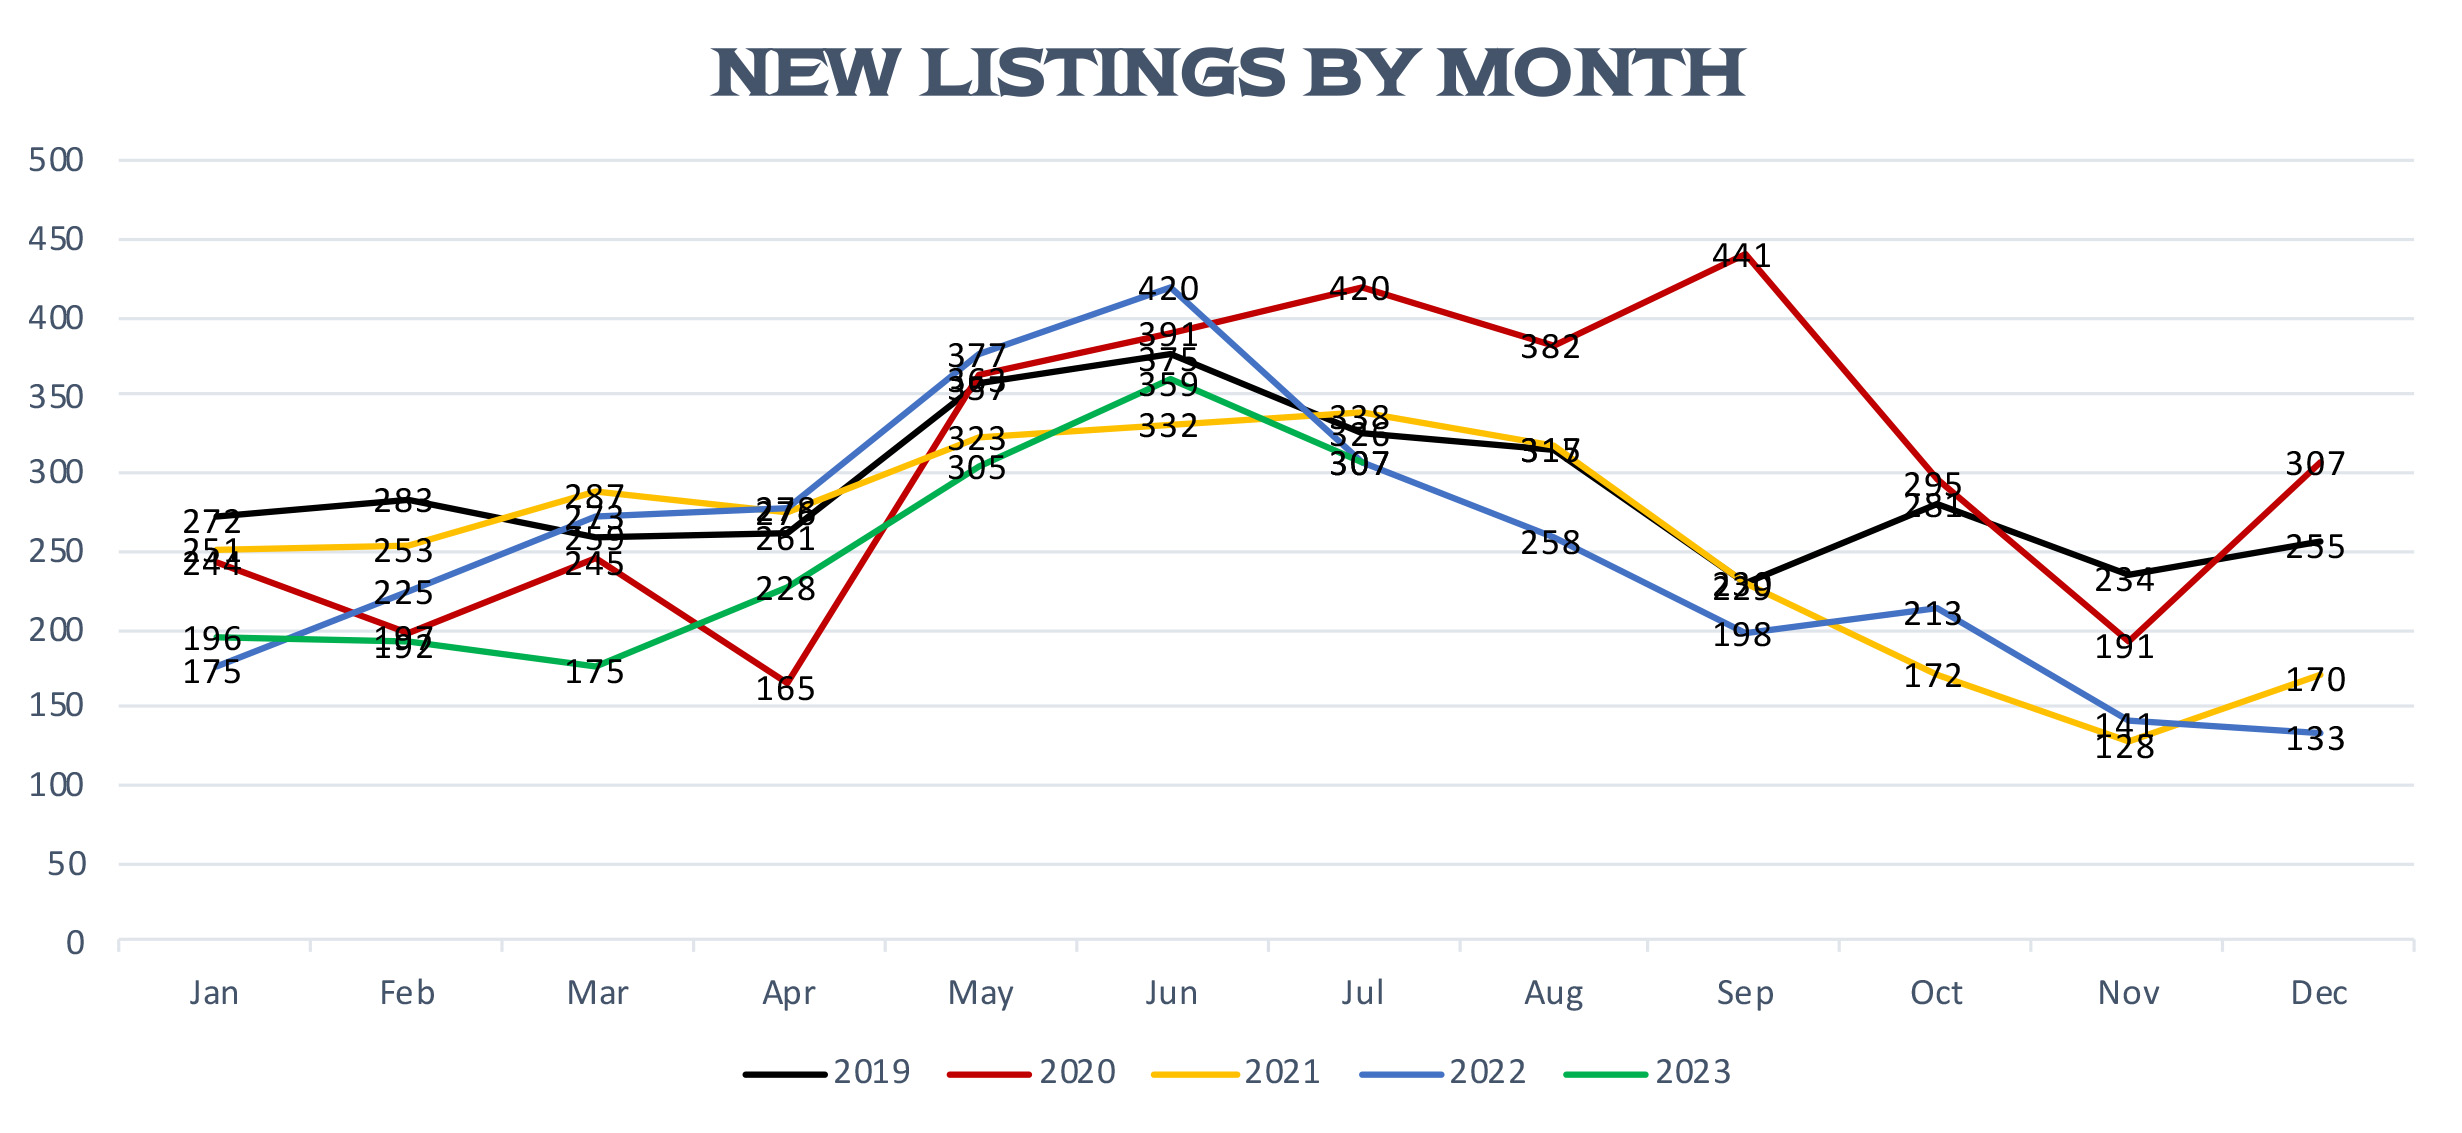
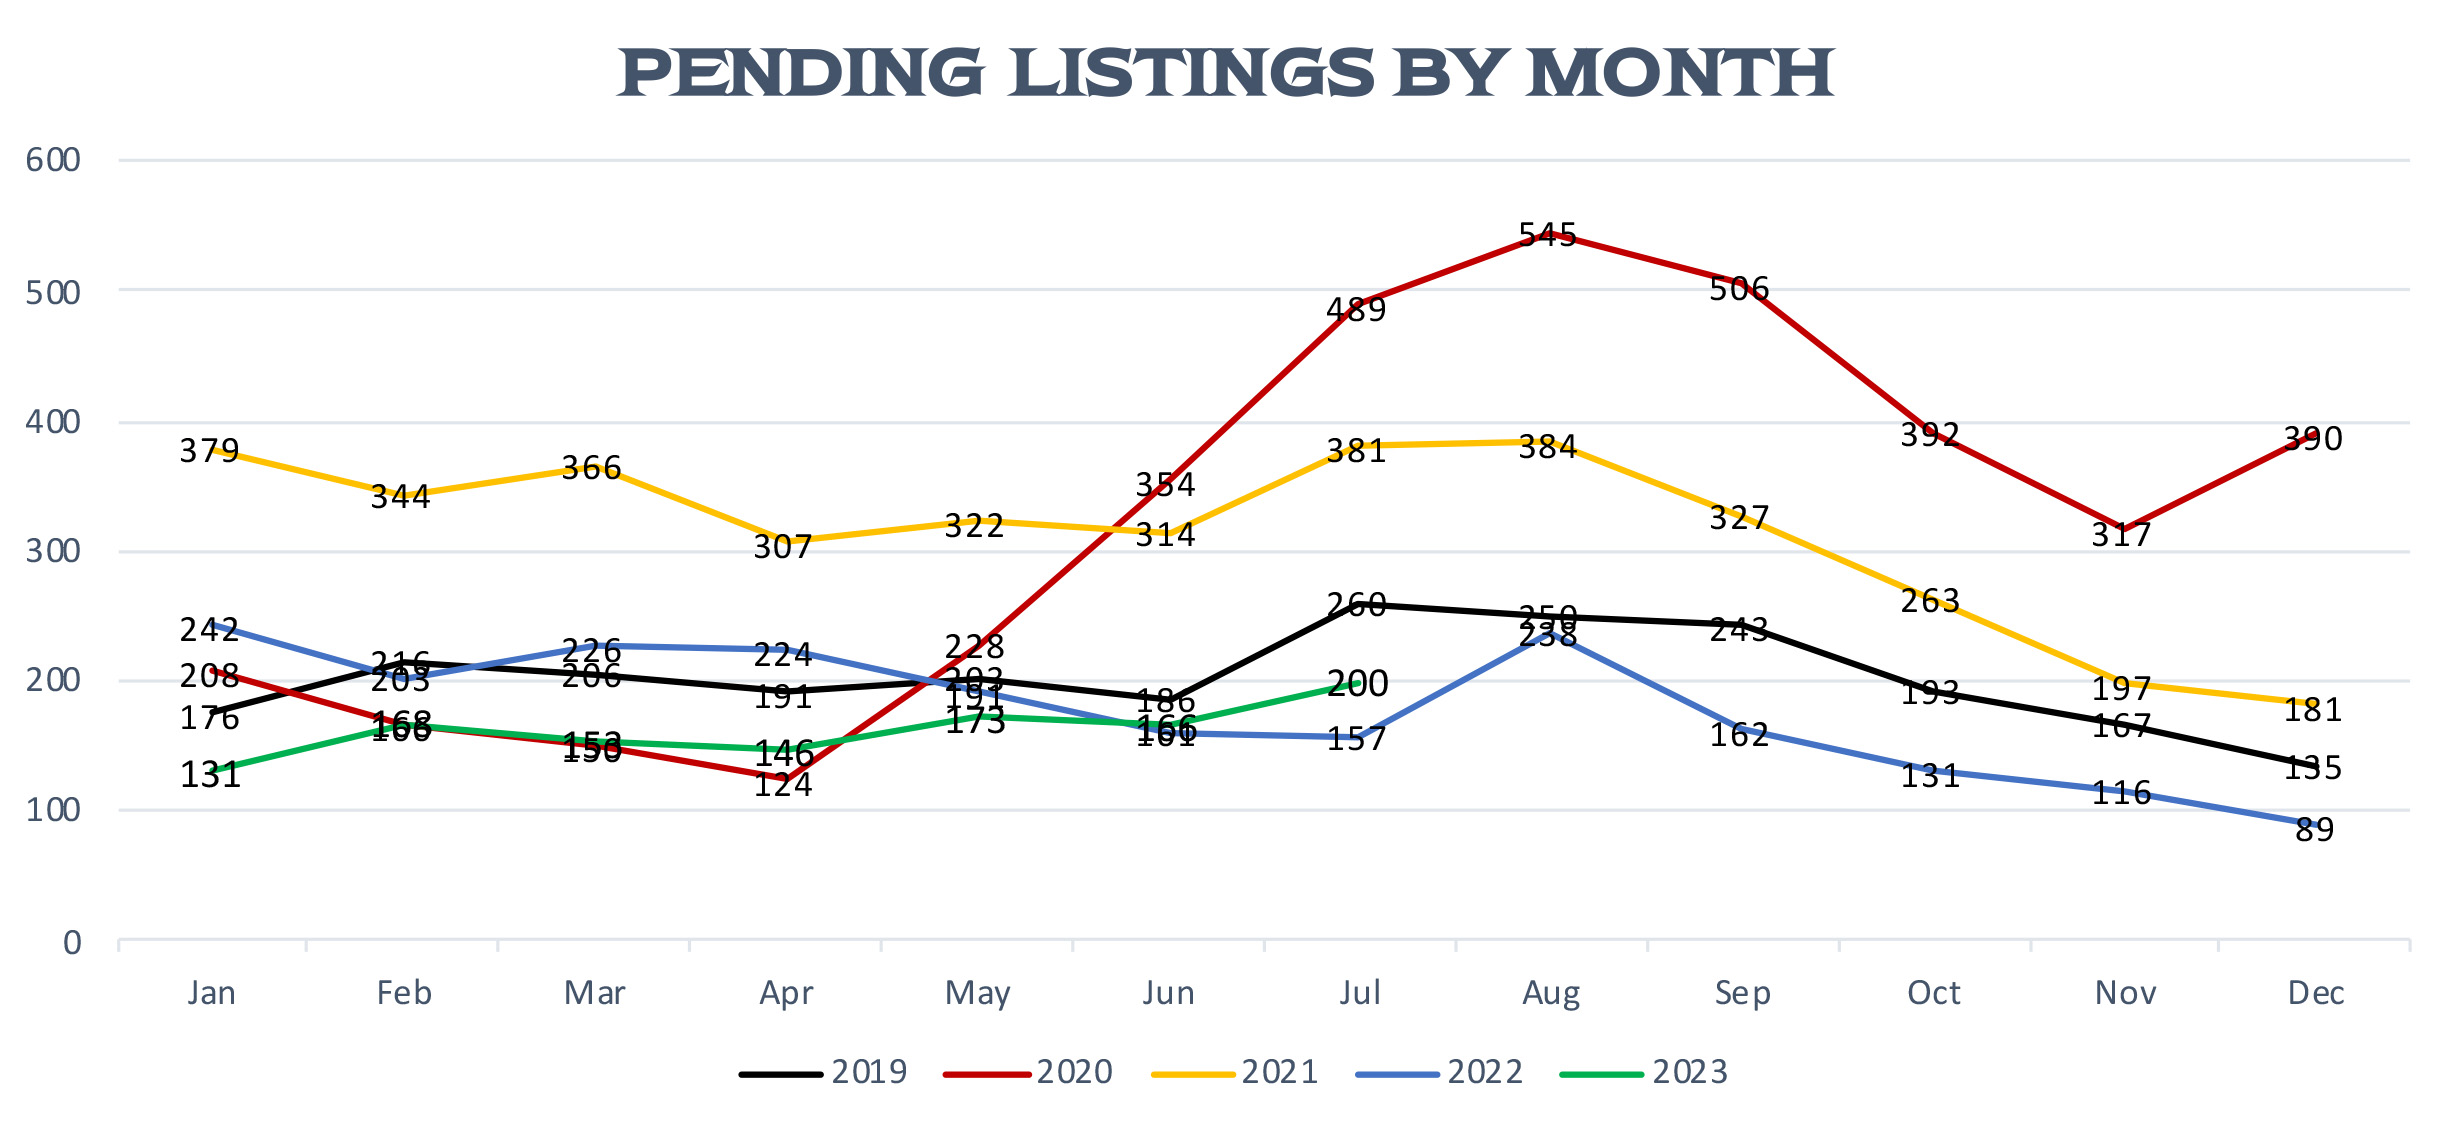
New Listings: New listings, which were being added to the system at a rate of around 200 per month for the past few months, jumped to over 300 in May and to 359 new additions in June. That number slid back to the May level in July (307). Pending Listings: One of the reasons that inventory has grown is because agents are writing far fewer contracts than they are listing new properties. 307 New listings were added in July, while only 200 contracts were written, making for a net gain in inventory of over 100 homes.
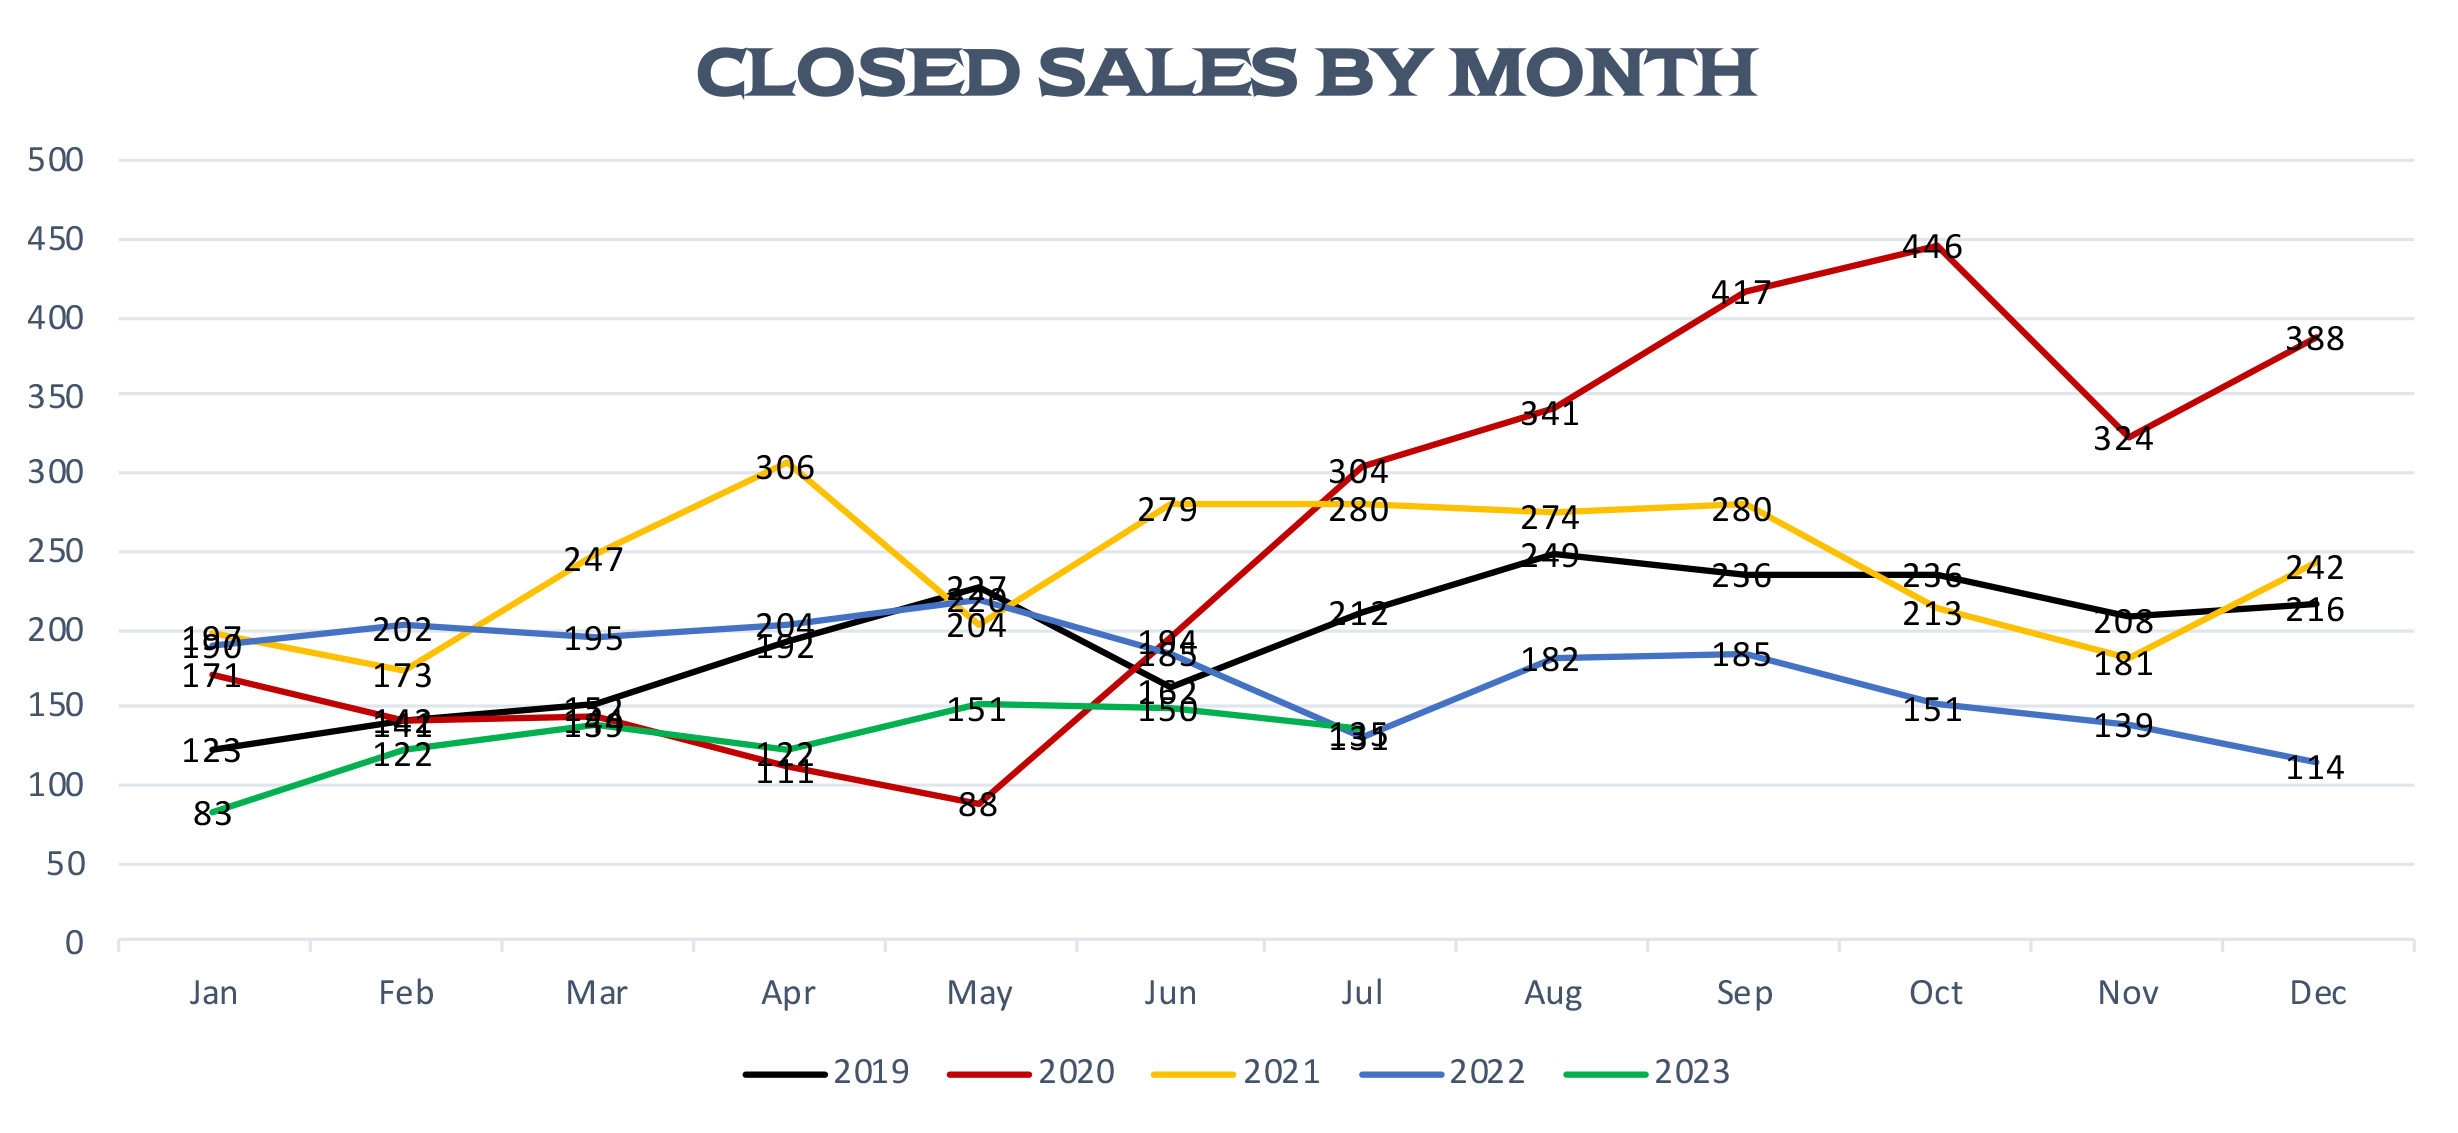
Closed Sales: 2022 showed a return to almost the same sales pace as we saw in pre-Covid 2019. 2,098 sales closed in 2022, just 256 fewer than sold in 2019 but 27% below 2021’s total (2,876). January 2023 retained its title as the slowest sales month in the past five years with just 83 sales. February and March posted month-over-month increases but still tallied 32-40% lower than a year earlier. Since April sales have fluctuated only a bit, staying between 120 and 150 through July.
Inventory: Active inventory for Residential and Land listings has hovered at around 1,250 listings since the first of the year. Suddenly, the spring (summer?) market arrived and inventory as of 5/31/23 jumped to 1,415, a 12% increase over last month. In June, the increase was 14% more, to 1,624, and in July 1,674, the most since July 2020 when Covid hit in force. We are now only 10% below the pre- Covid inventory of 1,868 in July 2020. For the second month in a row, there are over 1,000 residential listings for sale in PCMLS.
Data for this report was collected on the fifth of the current month and may not reflect all transactions for the latest measured Month. PCMLS participants have five business days in which to report status changes, so the deadline for changes through the end of the month would be by close of business the 7th of this month. The numbers for earlier months may change from previous reports as late changes are entered into the MLS despite the five-business day requirement.
Produced by the Park City Multiple Listing Service, Inc. © 2022-23 – May be reprinted with attribution.
Park City Active Listing Inventory Report
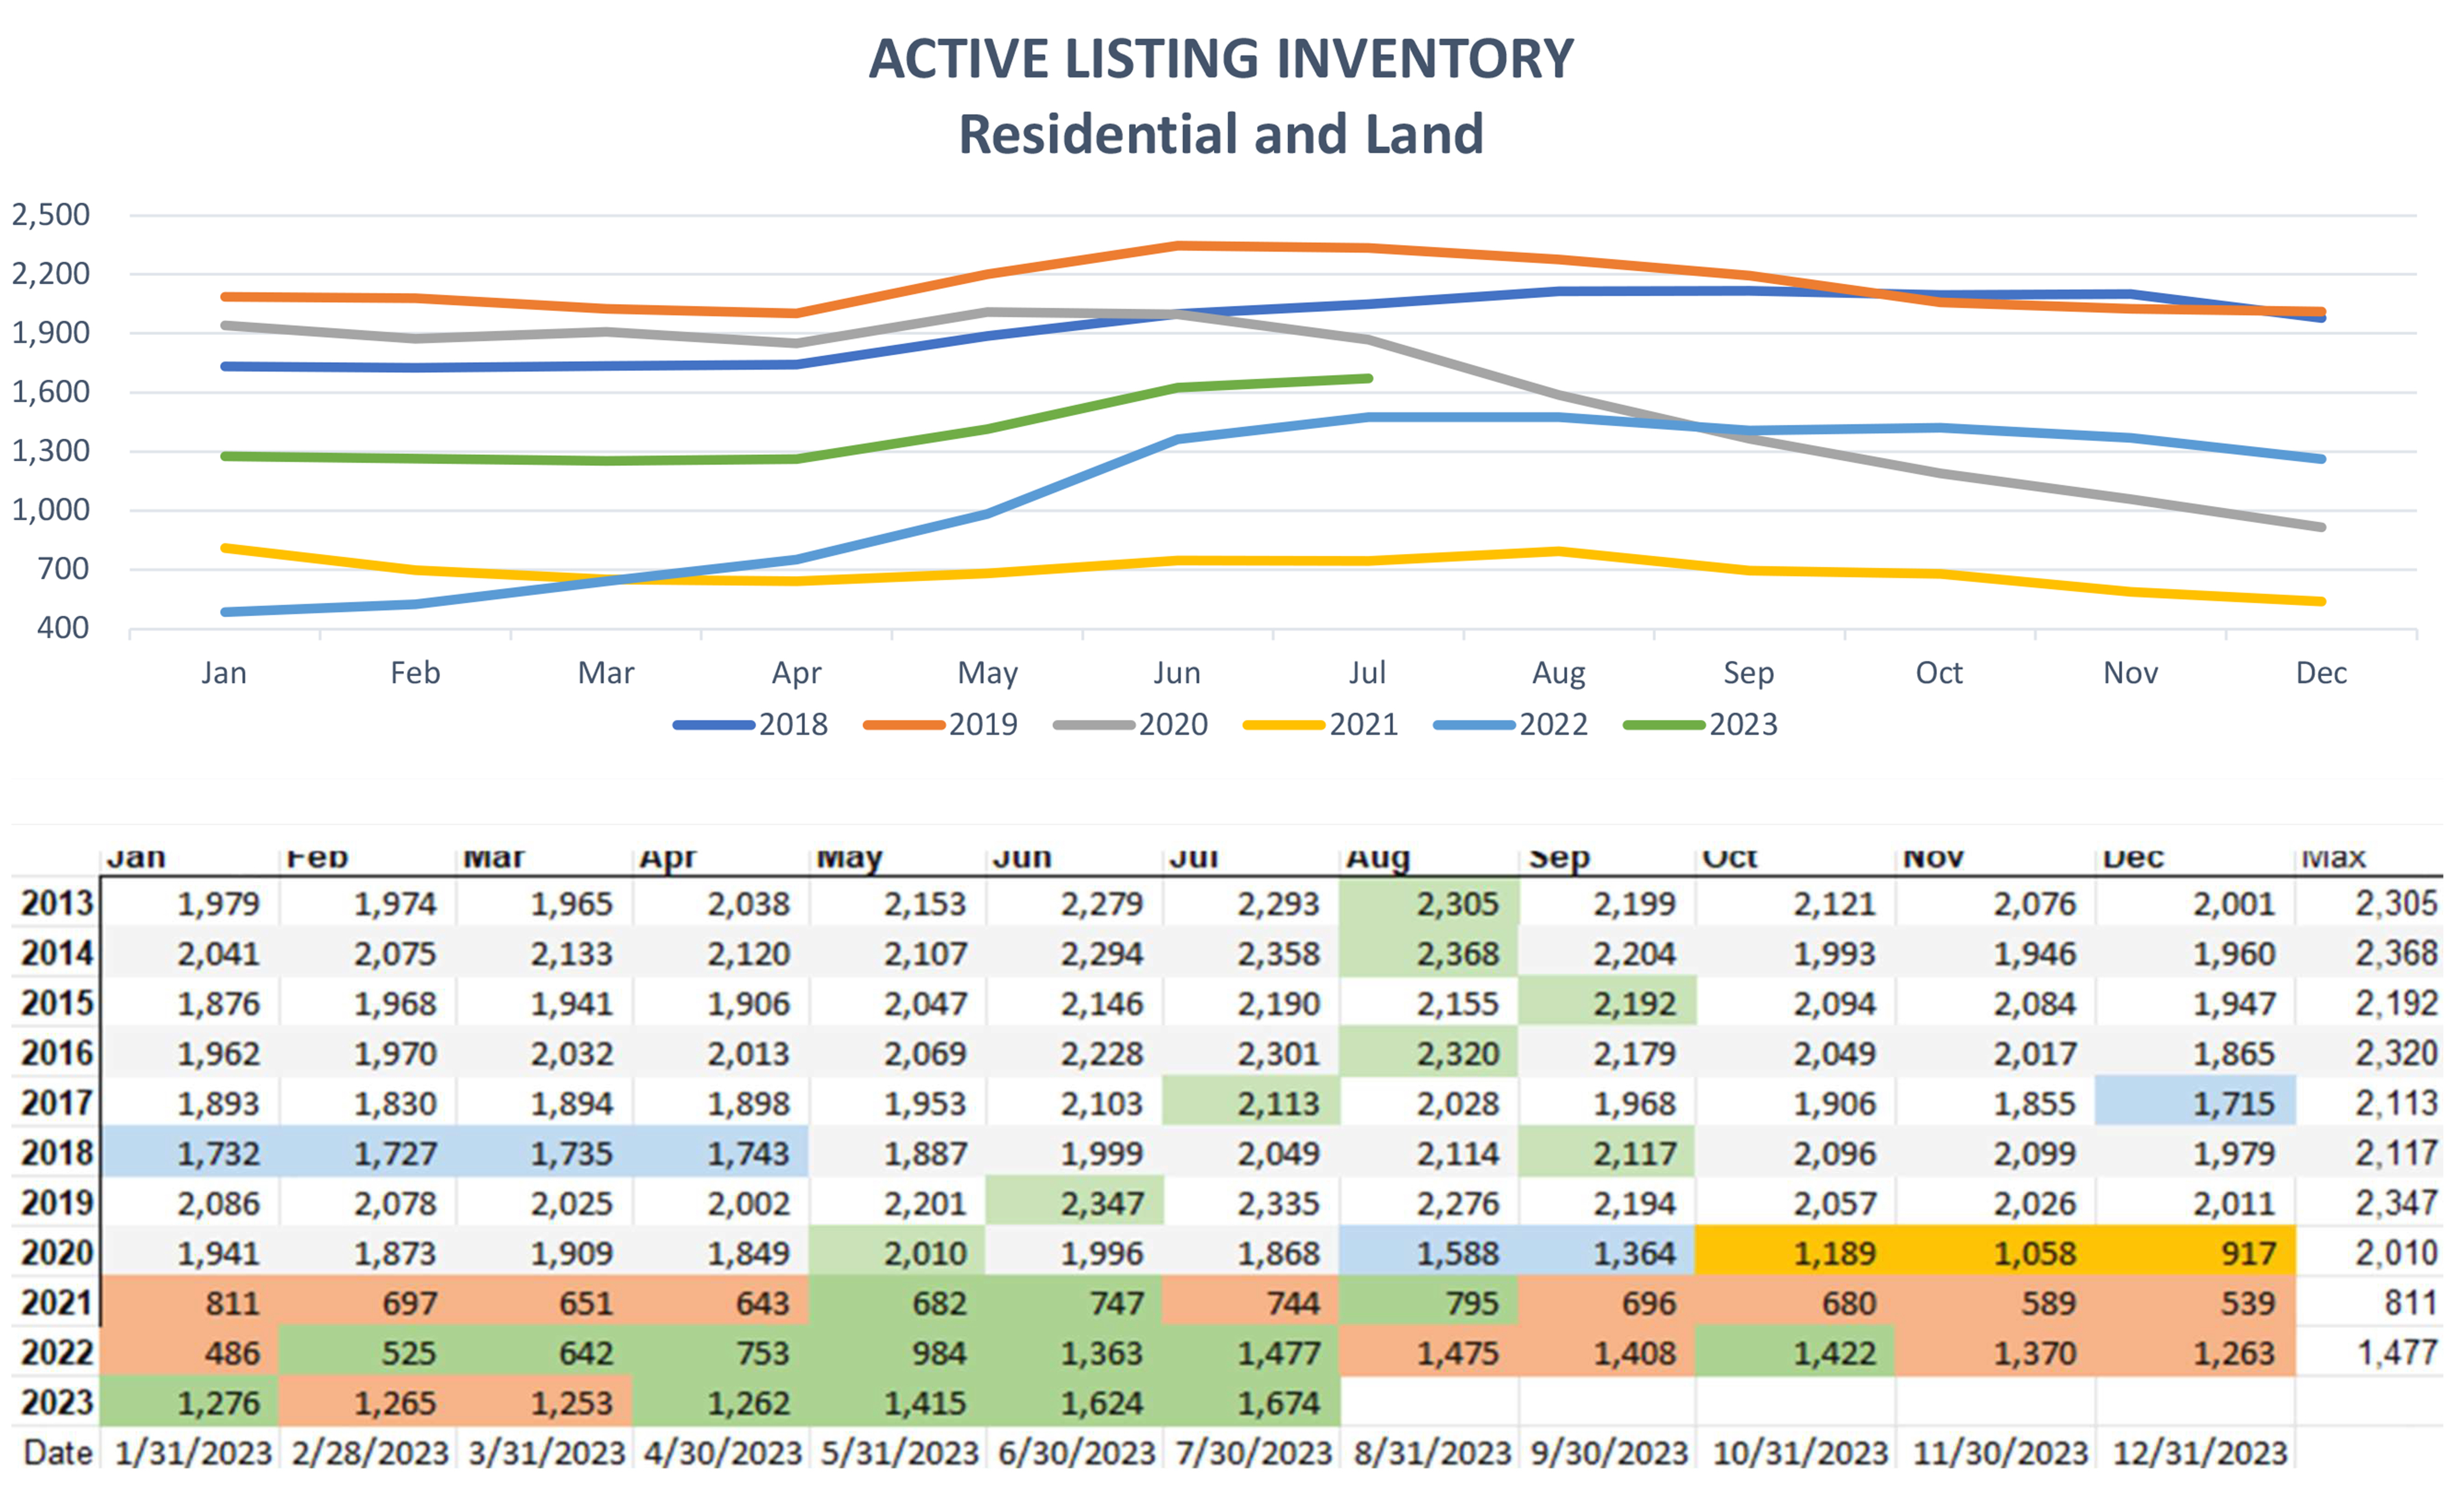
Before August 2020 Inventory had dropped below 1,800 units only five times in the past eight years (highlighted in blue), from December 2017 through April 2018. The nadir in that five-month stretch was 1,715 in December 2017. At the end of the year 2021, active listing inventory was down to 539 listings. This was the lowest number of listings at the end of a month in the last nine years. But the drop continued into 2022 with January finishing at only 486 listings. By the end of February, the trend reversed direction and increased by 39 listings to 525, followed by a rising or level inventory up until September. Totals since then have been mixed. 2022 finished the year with 1,263 active listings, the highest year-end inventory in the past three years. In 2023 inventory was flat for the first four months. That changed in May when inventory jumped 12.1% to 1,415, fully 43.8% higher than in May 2022. The trend continued in June with 209 more net listings added, up 15% from May.
**Comments are the personal observations of the Park City MLS Director and do not reflect the opinions of the Board or its leadership. Park City Board of REALTORS® will continue to monitor the market and report our findings monthly. For further information, please contact the Park City Board of Realtors® at 435-200-6900 – Produced by the Park City Multiple Listing Service, Inc. © 2022-23 – May be reprinted with attribution.
Explore the distinct real estate markets within each Park City neighborhood. For comprehensive insights into a specific area, feel free to contact us. We're here to help!
Contact
Posted by Utah Ski Properties on
Enjoy this blog post? Click here to subscribe for updates
Leave A Comment